The share of Bitcoins at a loss has reached its highest level since 2020, which may indicate an approaching market bottom. At the same time, there is a significant reduction in on-chain activity and an increasing outflow of capital from the cryptocurrency market in favor of American stocks.
This is reported by Finway
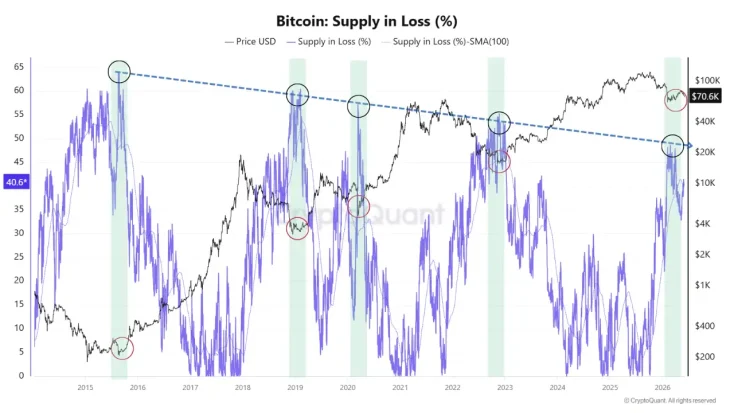
Historical Patterns of the Bitcoin Market
According to analysts at CryptoQuant, currently 40.6% of the Bitcoin supply is at a loss. Historically, such figures have often coincided with periods of market bottom formation. According to the company’s research, since 2015, every major decline in Bitcoin’s price has occurred after testing the downward trend line of the share of coins at a loss. It is worth noting that in each new market cycle, a lower percentage of the loss-making supply was needed to reach the bottom.
In previous years, the market bottom was formed when over 60% of coins were at a loss, but in recent cycles, this threshold has decreased. Currently, the critical zone is considered to be around 40%. Analysts believe that this decline indicates structural changes in the market. The majority of Bitcoins are now concentrated among long-term investors, ETFs, institutional players, and large capitals that better withstand volatility.
“CryptoQuant noted that the current value of the indicator demonstrates a high level of market stress, but has not yet reached historical zones of ‘maximum opportunity’. According to analysts, if Bitcoin continues to weaken, a retest of this multi-year structure may again create a favorable zone for accumulating the asset.”
At the same time, the increase in the share of loss-making coins is often accompanied by the exit of less resilient investors from the market and the activation of long-term capital that accumulates supply.
Decline in On-Chain Activity and the ETF Effect
According to observations by Santiment, the Bitcoin network is showing a significant decline in activity compared to the peak values of 2021. If in May 2021, there were over 1.12 million active addresses registered daily and nearly 489 thousand new wallets, these figures have now fallen to 624 thousand and 278 thousand, respectively. This indicates a decrease in the number of market participants and new users.
Despite the fact that Bitcoin’s price often exceeds the levels of 2021, network activity has not recovered to previous highs. Experts believe this is due to the growing popularity of Bitcoin exchange-traded funds (ETFs) and the increasing share of long-term investors who rarely move their assets between wallets. ETFs allow investors to access Bitcoin without the need for direct interaction with the blockchain, which also reduces the need to create new addresses.
Analysts emphasize that low network activity is not always a negative signal for the market. Historically, sharp price changes have stimulated new waves of activity among users.
Reorientation of Investors to US Stock Markets
An additional influencing factor has been the shift in balance between the cryptocurrency and traditional financial markets. From May 6 to June 1, 2026, the S&P 500 index rose by 4%, while Bitcoin lost 13% and gold lost 5%. This indicates a shift of some capital from cryptocurrencies to American stocks, driven by positive expectations regarding the policies of US President Donald Trump and the growth of the stock market.
Experts note that when stocks demonstrate higher returns with lower volatility, investors tend to prefer more stable assets. As a result, some funds leave the crypto market, especially during periods when Bitcoin does not show a strong upward trend even amid active demand for ETFs.
At the same time, analysts stress that this dynamic is not immutable. The market has already experienced periods where fear in the crypto market and FOMO in stock exchanges have shifted to opposite trends.
It is worth noting that in May, Bitcoin and Ethereum ended the month in the red, accompanied by an outflow of nearly $3 billion from ETFs and an increase in geopolitical tension.
